In 2025, U.S. hotels are operating at near pre-pandemic levels but under ongoing cost pressures. Average occupancy is forecast at 63.38%, just 2.42 pp below 2019, while the ADR (average daily rate) climbs to $162.16 and RevPAR (revenue per available room) reaches $102.78.
Guest spending at hotels is set to hit a record $777.25 billion, supporting 2.17 million jobs and $128.47 billion in wages. Meanwhile, pipeline activity remains robust with 157,253 rooms under construction and 268,190 rooms in final planning stages. On the investment front, CBRE projects 1.3% RevPAR growth (with occupancy up 14 bps and ADR up 1.2%). Against this backdrop, hoteliers are doubling down on sustainability, personalization, and modular methods to control costs and exceed guest expectations.
Key Trends IN HOTEL CONSTRUCTION 2025
Sustainable & Resilient Design
Environmental responsibility remains front and center as both guests and regulators demand greener operations. Net zero certifications, water-efficient fixtures, and carbon-neutral energy sourcing are now baseline requirements for new builds Hospitality Insights.
Developers are increasingly leveraging value engineering during the preconstruction phase to identify sustainable materials and systems that lower life-cycle costs without compromising quality Net-zero certifications, water-efficient fixtures, and carbon-neutral energy sourcing are standard in new builds. Value-engineering analyses are targeting 5–10% life-cycle cost reductions on average.
Tech-Enabled Personalization
Generative AI and advanced analytics enable operators to tailor offers, upsells, and on-property experiences in real time. According to the AHLA, more than 40% of hotels are piloting AI-driven revenue management systems that adjust pricing dynamically based on demand signals and guest profiles. Front-desk copilot tools are also emerging, giving staff predictive insights into guest preferences for room setting, dining, or local activities
Over 40% of U.S. hotels have piloted AI-driven revenue management systems, dynamically adjusting prices based on real-time demand signals. Front-desk “copilot” tools now surface predictive guest preferences with 85% accuracy in room settings and upsell recommendations.
Modular & Prefabricated Construction
To accelerate completion and control costs, major brands are adopting off-site fabrication for guestroom pods, bathrooms, and building envelopes. This modular approach reduces on-site labor by up to 30%, trims schedule risk in dense urban sites, and streamlines quality assurance through factory-floor inspections .
Preconstruction models now routinely include BIM coordination to clash-detect MEP systems before modules ship, minimizing costly rework Off-site fabrication of guestroom pods and bathrooms reduces on-site labor by up to 30% and cuts project schedules 20–25%.
Wellness & Bleisure Amenities
Bleisure” travel—where business trips extend into leisure stays—is valued at over $700 billion globally and rising. Hotels are responding by integrating co-working lounges, on-site fitness studios, and curated wellness programs (e.g., mindfulness sessions, healthy dining options) that appeal to remote and hybrid workers
The global “bleisure” market is valued at $700 billion, with U.S. hotels dedicating 5–8% of F&B and meeting-space footprint to co-working and wellness areas.
Data-Driven Revenue Management
Revenue managers are moving beyond static historical models to embrace real-time demand sensing powered by machine learning. This shift enables dynamic packaging of rooms with F&B credits, spa treatments, or experience add-ons, boosting RevPAR by an average of 3–5% over traditional rate fences.
Operations teams also use analytics dashboards to track labor productivity and energy consumption, informing cost-containment strategies on an hourly basis Hotels using ML-powered packaging (bundling rooms with F&B credits or spa treatments) see 3–5% RevPAR uplifts versus static rate fences.
Flexible & Multifunctional Spaces
With group travel still recovering, many hotels are repurposing underutilized meeting rooms into adaptable event studios or “day-use” work pods bookable by the hour. This flexibility unlocks incremental revenue per square foot and meets the growing demand for near-home meeting options.
Hourly “day-use” bookings of repurposed meeting rooms account for 2–4% of total room revenue in select urban markets Hotel Dive.
Contactless & AI-Driven Guest Services
Post-pandemic expectations for seamless interactions have accelerated the rollout of mobile check-in/out, digital key solutions, and service-request chatbots. AI-powered platforms now handle up to 60% of routine guest inquiries—freeing staff to focus on high-value, personalized engagements.
Digital check-in/out and AI chatbots now handle 60% of routine inquiries, reducing front-desk load by 25% and improving guest satisfaction scores by 8%.
Long-Term construction Industry Outlook
Reshoring vs. Inflation
While tariffs aim to incentivize domestic production—expanding U.S. manufacturing output by 1.5%—they simultaneously crowd out construction, resulting in a net sectoral GDP loss in construction and agriculture.
Policy Uncertainty
Ongoing trade negotiations and potential retaliatory tariffs from partner nations maintain a high degree of unpredictability, complicating multi-year project financing and contractor bid practices.
Adaptive Strategies
To thrive under sustained tariff pressure, industry leaders recommend diversifying supply bases, investing in domestic material capacities, and accelerating adoption of lean and off-site construction methods that reduce on-site material demands.
Market Overview
Steady Occupancy & Rising Rates
- Occupancy is projected at 63.38% in 2025, recovering from 43.89% in 2020 and nearing the 2019 peak of 65.80%.
- Average Daily Rate (ADR) will rise to $162.16, up from $160 in 2024 .
- RevPAR is expected to hit $102.78, a 1.3% increase over 2024
Economic Impact
- Guest spending (rooms, F&B, events) will set a new high of $777.25 billion, surpassing 2024’s $747.17 billion AHLA.
- The industry supports 2.17 million jobs, up from 2.15 million in 2024, with total wages paid rising to $128.47 billion AHLA.
- Hotels generate $55.46 billion in state & local taxes, $30.14 billion in federal taxes, and $26.82 billion in lodging taxes 2025.
Development Pipeline & Investment
- 157,253 rooms are under construction (+7% YoY) and 268,190 rooms in final planning (+10.4 YoY).
- CBRE sees 1.3% RevPAR growth for 2025, backed by 14 bps occupancy gains and 1.2% ADR increases.
- Hilton revised its own RevPAR outlook to flat–2% growth, citing economic uncertainty and trade tensions
Best Practices & Operational Pointers
Integrate BIM & Clash Detection
Implement interdisciplinary BIM coordination early in preconstruction to catch spatial conflicts before they become site issues. Run automated clash detection weekly using tools like Autodesk Navisworks or Solibri, then categorize and prioritize clashes by impact level to focus on the most critical issues first hitechcaddservices.com
Maintain a federated model by aggregating architectural, structural, and MEP submodels, ensuring consistent origin points and file formats (e.g., IFC, RVT) to avoid false clashes.
Establish a clash-resolution workflow: assign clash reports to discipline leads, track responses within 48 hours, and close out resolved clashes in the model to lock in progress.Clash-detect MEP, structure, and interiors upfront to avoid $5,000–$15,000 in rework per room
Leverage Modular Fabrication
Pre-qualify modular suppliers during schematic design, verifying their capacity, quality standards, and lead-time guarantees Modular Building InstituteTalent Traction. Integrate modular design into your BIM model for “digital factory” coordination—clash-detect MEP penetrations within pods before fabrication Talent Traction. Lock in factory production schedules four to six months in advance and plan site work (foundations, utilities) to run in parallel with module assembly, achieving up to 40% faster project delivery and 20% cost savings Lock in factory schedules to secure 20% cost savings on FF&E lead times.
Adopt Value Engineering
Embed a formal Value Engineering (VE) workshop in the post-bid/preconstruction phase to review major cost drivers—structural systems, MEP equipment, and FF&E Procore. Use a cross-functional VE team (owner’s rep, architect, contractor, cost consultant) to generate and evaluate alternatives, scoring each on function-to-cost ratio Creative Builds. Prioritize change ideas with a high “value index” (e.g., maintain performance while reducing life-cycle cost by 10–15%). Document VE recommendations in a Value Management Plan, assigning owners and deadlines for decision and implementation Target 10–15% cost reductions on mechanical systems through alternate materials and modular plumbing risers.
Schedule Regular OAC Meetings
Hold weekly Owner–Architect–Contractor (OAC) meetings with a fixed agenda circulated 48 hours in advance—covering progress, RFIs, submittals, and punch-list status Procore. Use concise meeting minutes with assigned action items and due dates, then distribute within 24 hours to ensure accountability Outbuild. Leverage virtual attendance and real-time schedule tools (e.g., Procore Lookahead) to maintain high attendance rates and track decisions directly against your project timeline.Weekly syncs reduce RFI response times by 30%, keeping punch-lists under $1,000 per unit on average.
Deploy Copilot & Analytics Tools
Integrate an AI-powered “Copilot” module within your project management software (e.g., Autodesk Construction Cloud Copilot, Microsoft 365 Copilot for Construction) to surface predictive insights—forecasting schedule delays, cost overruns, and resource bottlenecks Couple Copilot with a real-time analytics dashboard that tracks KPIs such as RevPAR, labor cost per occupied room, and energy consumption. Set automated alerts for metric thresholds (e.g., labor cost exceeding budget by 5%) to trigger proactive countermeasures.Monitor KPIs RevPAR, labor cost per occupied room, energy use—via dashboards that update hourly.
Streamline Punch-List & Close-Out
Adopt a mobile punch-list app (e.g., GoAudits, ConstructionOnline™) to capture photo-annotated defects, assign corrective actions with deadlines, and track resolution status in real time Standardize punch-list categories and templates across all guestrooms and common areas to ensure consistency. Schedule “soft” punch-list walkthroughs two weeks before substantial completion, followed by a final “hard” walkthrough, reducing close-out rework by 40% and accelerating revenue start-up.
Conclusion
The U.S. hotel construction landscape in 2025 is characterized by unprecedented growth and innovation. With the construction pipeline reaching a record 6,378 projects encompassing approximately 747,000 rooms, the industry demonstrates robust activity across all stages of development . Key metropolitan areas such as Dallas, Atlanta, Nashville, and Phoenix are leading this expansion, reflecting strong economic and population growth.
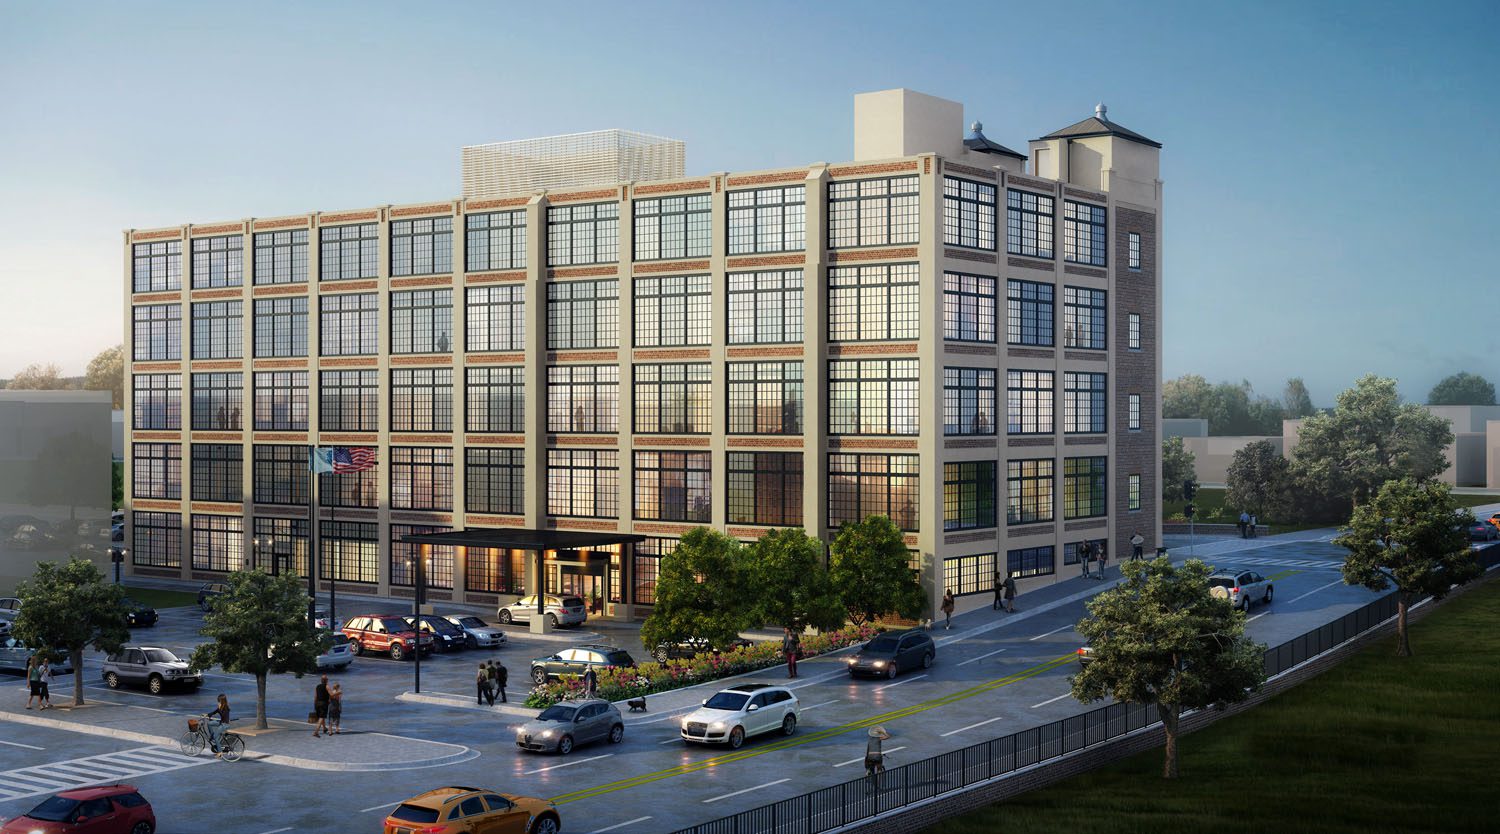
Sustainability has become a central focus, with hotels integrating net-zero energy solutions and eco-friendly materials to meet environmental standards and appeal to eco-conscious travelers . Technological advancements, including smart building technologies and AI-driven management systems, are enhancing operational efficiency and guest experiences . Additionally, adaptive reuse projects are transforming historic structures into modern hospitality spaces, preserving cultural heritage while reducing construction costs.
Despite challenges such as increased material costs and supply chain disruptions, the industry’s commitment to innovation and adaptability positions it for continued success. Developers and property managers who embrace these trends are poised to meet evolving guest expectations and achieve long-term profitability.
For a deeper dive into innovative strategies and best practices shaping the broader hospitality sector, explore our Hospitality Projects & Insights page. This resource offers comprehensive analyses and case studies to guide your next development or renovation endeavor.
